Comparing the South German oak curve towards the Hollstein curve
After the extra ring was removed from the South German oak
curve (SGERMOAK), the curve was compared to the Roman time curve
of Hollstein (ref 4).
SGERMOAK_of_D:\ake\tree\Herculaneum\Herculaneum.rwl using No detrend
compared to the reference
Hollstei_of_D:\ake\tree\Herculaneum\Herculaneum.rwl of length 676 using No detrend  Dated to 336
Minimum overlap used when finding best match: 40

Table sorted by Proportion of last two years growth (2,0,T (P2Yrs)/TTest

--Rel Over  *P2Yrs------  BaPi-------  BesIE------  Skel-  GLK--  (year)              *Corr
-year  lap   CorrC TTest  CorrC TTest  CorrC TTest   Chi2    GLK                     StdDev
  236  399    0.53  12.6   0.49  11.3   0.47  10.7   51.2   0.71   (100) (as dated)  (0.14)
    7  399    0.23   4.7   0.15   2.9   0.13   2.6    0.0   0.58   (329)             (0.21)
 -352   47    0.44   3.3   0.42   3.1   0.44   3.2    0.4   0.71   (688)             (0.03)
    9  399    0.16   3.3   0.07   1.3   0.09   1.7    3.6   0.54   (327)             (0.19)
The high T-value of 12.6 indicates that the matching is very good. A block correlation analysis
revealed - what could also be seen by visual inspection - that the
curves matched well except for the oldest 60 years which match
with a correlation coefficient of only 0.26. The younger sections
(BC 240 - AD 100) of the curves had a correlation coefficient = 0.58
The South German Oak curve is identical to Bernd Becker's curve of 1981!
We also came to check the South German Oak curve to a curve
published by Bernd Becker in 1981 (ref 8). We found the curves to be
identical except for scaling and for an apparent misreading of
Becker's ring width value for BC 287.
South German Oak curve (red/green) compared to Bernd Becker's curve of 1981 (black/blue).
Red numbers "0.98" at the bottom of the diagram indicate correlation coefficient values for 40 years long segments of the upper normalized curves.
The lower curves are ring width curves.
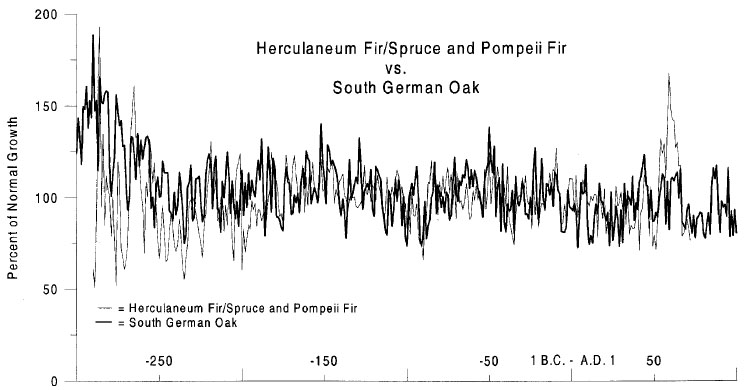
Comparing the Herculaneum mean value curve towards the South
German oak curve
A correlation analysis run between the Herculaneum mean value
curve (herculan) and the South German oak curve shows:
--Rel Over  *P2Yrs------  BaPi-------  BesIE------  Skel-  GLK--  (year)              *Corr
-year  lap   CorrC TTest  CorrC TTest  CorrC TTest   Chi2    GLK                     StdDev
   28  360    0.25   5.0   0.22   4.3   0.26   5.2    2.5   0.60    (72) (as dated)  (0.26)
   36  360    0.19   3.8   0.16   3.1   0.18   3.5    5.0   0.55    (64)             (0.18)
  215  184    0.23   3.2   0.22   3.1   0.26   3.6    5.3   0.59  (-115)             (0.10)
Relative position (index) 0 is then considered to correspond to
the dating year of the South German oak curve, AD 100. Relative
position 28 then corresponds to AD 72 as indicated above as the
best match.
The above analysis shows that the correlation for the whole
Herculaneum curve towards AD 72 of the South German oak curve is
not too good with a correlation coefficient of only 0.25 - this is
by no way "extraordinarily good"!
Though a blockwise correlation analysis with blocks of 50 years
length shows something of great interest:
Block  -----Aimed------   -------Best
start  --------at  year   around that
    0     28 0.50    72      28 0.50
   25     53 0.52    47      53 0.52
   50     78 0.41    22      78 0.41
   75    103 0.58    -3     103 0.58
  100    128 0.58   -28     128 0.58
  125    153 0.40   -53     153 0.40
  150    178 0.25   -78     176 0.34*
  175    203 0.20  -103     203 0.20
  200    228 0.58  -128     228 0.58
  225    253-0.03  -153     252 0.20*
  250    278-0.05  -178     277 0.23*
  275    303 0.18  -203     302 0.19*
  300    328-0.01  -228     327 0.11*
Lowest block CorrC = -0.05 at index 250, year=-178
I.e. there is a very good match between the younger parts of the Herculaneum curve and the South German Oak curve!
A further analysis showed:
The segment 0-168 of the Herculaneum curve (BC 97 - AD 72) matches the South German Oak curve with the
correlation coefficient = 0.51, T-value = 7.6
The segment 168-239 (BC 168 - BC 97), 72 years, matches with a correlation coefficient of 0.27.
The segment 239-359 (the rest) (BC 288 - BC 168), 120 years of the Herculaneum curve - the oldest segment -
gives the correlation coefficient = 0.02 and there is no obvious missed or extra rings within it.
I.e. the oldest 120 years of the Herculaneum curve does not match the South German oak curve!
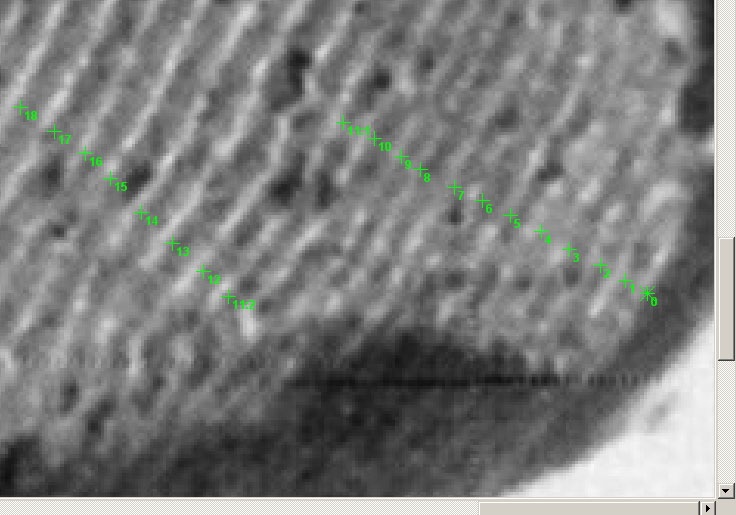
Figure 189 - An unburned cross section
There are two pictures of cross cuts in the
article, both with resolution high enough to allow for measurement
of the ring widths (with an unknown scale factor). The first one
with the caption: "Figure 189 An unburned cross section of
spruce with tree rings from 291 B.C. to 129 B.C."
The data we could measure from the picture was found to cover the
time span BC 280 to BC 131 (We used the identity HPC2, see below).
It had an excellent match towards the retrieved Herculaneum curve and
has probably been used as a part of that curve when that curve was created.
The correlation coefficient is 0.64 with an overlap of 149 years (T=10.1).
Comparing with the South German Oak curve
When we compared this curve towards the South German Oak curve, we had to force
CDendro to show the implied match at BC 131 by limiting the search range:
WARNING: The search was LIMITED to the year interval -135 to -125

Table sorted by Proportion of last two years growth (2,0,T (P2Yrs)/TTest

--Rel Over  *P2Yrs------  BaPi-------  BesIE------  Skel-  GLK--  (year)              *Corr
-year  lap   CorrC TTest  CorrC TTest  CorrC TTest   Chi2    GLK                     StdDev
  228  149    0.17   2.1   0.17   2.1   0.12   1.5    4.9   0.59  (-128)             (0.17)
  225  149    0.06   0.7   0.10   1.3   0.05   0.6    0.3   0.52  (-125)             (0.17)
  232  149    0.04   0.5   0.04   0.4   0.05   0.6    0.0   0.43  (-132)             (0.16)
  230  149    0.04   0.5  -0.02  -0.3   0.09   1.0    7.6   0.54  (-130) (as dated)  (0.22)
  229  149    0.01   0.2   0.08   1.0   0.10   1.2    0.5   0.48  (-129)             (0.12)
  233  149   -0.02  -0.3   0.01   0.2  -0.05  -0.6    0.3   0.50  (-133)             (0.15)
  231  149   -0.03  -0.4  -0.03  -0.4   0.02   0.2    0.0   0.51  (-131)             (0.17)
This means that this unburned cross section does not at all match the South German Oak curve at the implied position.
As the Herculaneum curve matches the South German Oak curve over the segment BC 168-131 (corrCoeff=0.57) we had expected to find some
matching within that interval for the "unburned cross section", though its correlation coefficient for that segment is -0.06! - No match at all!
We then have to consider whether the Herculaneum curve has possibly been built up from ring width curves without proper cross correlations!
Figure 190 – A charcoal cross section
|
Part of image pretended to show rings of BC 145 - AD 11 actually shows rings of BC 133 - BC 16
|
The article also contains a picture of a coaled
cross section with the caption "FIGURE 190 A burned cross
section of fir with tree rings from 145 B.C. to AD 11."
The sample contains a lot of cracks, but it is possible to measure
several sections and make a mean value ring width curve of them.
In this way we were able to measure 117 rings, but when this ring
width series (called HABC1A) was compared to the retrieved
Herculaneum mean value ring width curve, we found that it matched
at BC 133 to BC 16 (corresponding to index -15, see below) instead
of BC 145 - AD 11. We guess that there has been a mix-up of images during the
publication process.
HABC1A using No detrend compared to the reference
herculan using No detrend  Dated to 72
Minimum overlap used when finding best match: 50

Table sorted by Proportion of last two years growth (2,0,T) (P2Yrs)/TTest

--Rel Over  *P2Yrs------  BaPi-------  BesIE------  Skel-  Skel-  GLK--  (year)
--year  lap   CorrC TTest  CorrC TTest  CorrC TTest   Chi2  CorrC    GLK
   87  117    0.58   7.5   0.54   6.9   0.51   6.3    9.6   0.43   0.70   (-15) (as dated)
  133  117    0.36   4.2   0.35   4.0   0.29   3.3    2.7   0.22   0.57   (-61)
  163  117    0.31   3.5   0.26   2.9   0.21   2.3    9.2   0.30   0.62   (-91)
  187  117    0.28   3.1   0.21   2.3   0.20   2.2   13.0   0.19   0.59  (-115)
  117  117    0.26   2.9   0.24   2.7   0.20   2.2    0.3   0.18   0.50   (-45)
The retrieved data
For research purposes you may download the
retrieved data stored within a .rwl file contained in a zipped
file (ref 8). Please note, that we have removed that extra ring
found before AD1 from the retrieved ring width files. Except
for the curve data of the article, the .rwl file also contains a
mean value curve from the Hollstein data of the Roman time (ref
4). This retrieved data from the curves is by no way exactly the
same as that used by the author of the reviewed article. There are
certainly at least some misinterpretations introduced by us when
we retrieved the data from the curves. A measure of the actually small data
degeneration during the retrieving process is that the retrieved
data series match each other with a Baillie/Pilcher (B/P) T-value of 4.3
to be compared with the T-value = 4.44 reported by the author.
Although when we are using the P2Yrs method (proportion of last
two years growth, ref 5) we get a T-value of 5.0. The P2Yrs-method
has a lower risk of erroneous matches than B/P at the same
T-value. So with the retrieved data we actually found a stronger
support for the match than that implied by the 4.44 value reported
by the author. Another indication of the small data
degeneration is how well the retrieved South German Oak curve of
the diagram matches to that curve published by Bernd Becker (ref 7).
Discussion
The main message of prof Kuniholm's article was a
report that his institute had identified wood in Herculaneum and
partly Pompeii which originated from the Alpine region. He
characterized the curve matching between his Herculaneum mean
value curve and a South German oak curve as an "extraordinarily
good fit" but reports the very low T-value of 4.44 at an
overlap of 362 years. An analysis reveals that he could instead
have reported a T-value as high as 8.3 with an overlap of 250
years (P2Yrs) or at least 7.7 with the Baillie/Pilcher method,
often used by the Cornell institute. This seems to be a really
good match especially if we also consider that it is a match
between two so different species as oak and fir.
We may only speculate on why the oldest tail of
the Herculaneum curve does not match the South German Oak curve.
The quality of the South German Oak curve can be validated by
comparison with the Hollstein Roman time curve. The matchings seem
to be sufficient. The match between the measurements from figure
190 and the oldest tail of the Herculaneum curve is very good, so
there are little reason to expect that any severe errors were
introduced when we retrieved the data from the published curve.
Only the very oldest few years may be disputed.
The spruce and fir samples were separated into two
groups: the spruce (Picea abies) samples are all found in the
older part of the curve and the fir (Abies alba) samples in the
younger part. This means that it is the fir-part of the curve
which matches the German curve and the spruce part which does not.
May for instance different altitudes of the spruces and the firs
make the firs but not the spruces datable towards the oak
chronology? If so, the Picea-part of the curve hopefully could be
dated towards the Abies-part of the chronology, but unfortunately
no data which can prove the quality of this bridging between the
data is available nor is any discussion about the problem of the
non existent match between the spruce-part of the chronology and
the oak-chronology included in the article. So unfortunately there
is no evidence that the old tail of the chronology is correctly
dated.
Anyhow the reported overall T-value of 4.44, which
is about the same as we got (4.3), indicates that the error is
probably not to be found within our data retrieval. The
lack of published original measurements makes it impossible to
evaluate what has gone wrong!
We still hope that it will become more common to
publish original measurement data so that crossdating jobs can be
validated by anybody interested!
We think that dendrochronology performed without publishing all data is no science!
Keeping data used for an analysis secret after the analysis has been
published is not up to the scientific standards of natural science!
In this case
some data was made available (though not in the most
convenient format), but unfortunately not enough to verify the
correctness of the older part of the Herculaneum curve. We hope
that prof. Kuniholm and the Cornell institute will eventually
publish a follow up article in which enough data is included to
verify also the older part of the curve.
December 17 2009.
References
ref 1: P.I. Kuniholm, Dendrochronological Investigations at Herculaneum and Pompeii in book The natural History of Pompeii pp. 235-239 (See ref 2 below.)
http://dendro.cornell.edu/articles/kuniholm2002
(This link works in May 2015. An older link "www.arts.cornell.edu/dendro/HercPompCaptured.pdf" is broken.)
ref 2: W. F. Jashemski and F. G. Meyer, eds., The Natural History of Pompeii, Cambridge University Press (2002), pp. 235-239.
ref 3: T Axelson & L-Å Larsson, What is a good T-test value?
ref 4: L-Å Larsson, The German oak chronology - an analysis of some publically available data,
https://www.cybis.se/forfun/dendro/hollstein
ref 5: CybisWiki, P2Yrs:
https://www.cybis.se/wiki/index.php?title=P2Yrs
ref 6: Methodology: Catching the ring width data underlying a plotted curve,
https://www.cybis.se/forfun/dendro
ref 7: Becker, B.: (1981) FÄLLUNGSDATEN RÖMISCHER
BAUHÖLZER anhand einer 2350jährigen Süddeutschen
Eichen-Jahrringchronologie, Fundberichte aus Baden Württemberg
No.6, 369-386.
ref 8: Herculaneum and Hollstein data
|