|
Crossdating two ring width curves from individual trees is often a tricky process. Crossdating is much easier when a single curve is matched (crossdated) towards a mean value ring width curve created from several trees, i.e. when crossdating is done towards a reference curve. Then, what problems are related to the creation of such a curve? As the innermost ring widths of a tree are usually the widest ring widths of that tree we cannot create a proper mean value ring width curve by just adding all rings grown the same year together and divide by the number of trees. With trees of different age, the rings grown in young trees would then heavily dominate the yearly calculated ring width mean values. Not only tree age influences the growth of an individual tree. One tree might come from a place with rich soil, another from a place with poor soil. We might even have to consider that one of the trees lost several branches during a snowy winter resulting in a sudden drop in growth rate. Individual or many trees might have been attacted by insects also resulting in sudden drop of growth rate. Storms or forestry might result in a neighbour tree being removed, giving more light to the crown of our tree and freeing nutriment which will make the tree start growing faster than before. Detrending of a ring width curve, is the process of scaling the ring width curve to remove effects that are individual to the tree, e.g. the growth
rate because of age, effects of rich or poor soil, accidents like a lost big branch etc.
|
|
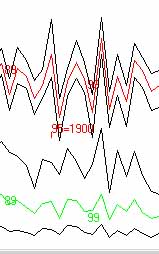
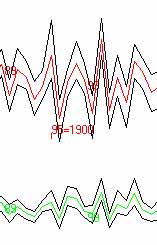
Normalization is used to prepare your ring width data for correlation analysis as part of your crossdating work. Within normalized data the low frequency component of tree growth has been removed, as these data values have been divided by mean values of ring width data taken from a very narrow frame shifted along the ring width curve during calculation. Practical experience shows that it is much easier to visually crossdate (match) normalized ring width curves than to visually crossdate original or detrended ring width curves. (For an example, see the two first curve diagrams in the beginning of the section "Dendrochronology curve matching and mathematics".) Detrending is used to remove effects that are individual to a tree so that mean values can be calculated from trees with different growth conditions. Detrending is necessary before calculation of a ring width mean value curve for a region. Note: You might detrend your ring width curves before you calculate the normalized curves, but this is not a necessary step. This is because long time variations in growth rate (removed by detrending) have little or no influence on the shape of a normalized curve and consequently on the crossdating results from correlation analysis on normalized data. |
|
The most elementary way of detrending a ring width curve is by dividing each ring width value with the
mean ring width value of the whole tree.
This scaling will make the shape of the ring width curve retained, while the mean ring width value of the whole curve will become "1".
These scaled ring width curves (=detrended curves) will be suited for calculating mean ring width curves though the trees' growth conditions might have been very different.
|
|
If the innermost rings of a tree are wider than the outer rings,
then a negative exponentially curve can be fitted to the ring width curve.
Each ring width is then divided by the corresponding value of that curve.
This will compensate for the decrease in growth related to aging.
Note: In CDendro the method for fitting a negative exponential curve (to be used for detrending) to a ring width curve, is complemented with an automatic
alternative in case an exponential curve cannot be fitted, i.e. when there is "no negative slope" (which matches a negative exponential curve) in the old end of the curve.
In such a case, every ring is instead divided by the ring width mean value of the whole curve, i.e. as for the radio button alternative "Indiv. mean".
|
|
To see the effect of detrending with the negative exponential curve, uncheck "Show detrending curve..." as shown above.
Then click the OK button.
|
|
Note: When one of the detrend options is turned on for a sample which itself is the reference then the shape of this reference ring width curve will be plotted the same way in all other sample windows! So if you want to compare Neg-Exp-deTrended ring width curves for a sample and a reference, you have to see that both the sample and the reference have their "NegExp detrend" radio buttons selected. Of course, if the reference curve is based on e.g. a .d12 file (a normalized file) containing an already Neg-Exp:ed ring width curve it should be displayed with the "No detrend" option (radio button). (After a change of option in another window, you may have to click the "Refresh curve" button when you are back at the curve you are analyzing.) |
The heavy detrend algorithm
|
The "Heavy detrend" algorithm of CDendro creates a detrend curve where each value is calculated as a mean of the nearest surrounding ring widths
contained within a frame of optional length. The mean value is calculated so that rings which are more distant to the current ring
are given lower weight than those near to the current ring.
Note: The "Settings/Set heavy detrend parameters" window can be left open while you work with your data. Technical details: The ring nearest to the current ring is given the weight "Start value" as defined on Settings/Set heavy detrend parameters. The following next nearest rings will get its weight from its neighbour but then successively multiplied with a "Stepwise reduction factor". The current point can best be included in the frame mean value to make the detrending curve as smooth as possible. With Start value = 0.85 and reduction factor 0.9 the weights will be 1 for the current ring width (if included) then they will be 0.85, 0.85 * 0.9, 0.85 * 0.9 * 0.9 etc. - When the frame touches any end of the curve, it will successively shrunk but retain its symmetry around the current point until it has shrunk to a "Minimum length". |
Collections:
No detrending implies high standard deviation |
With detrending implies low standard deviation |
|
When creating a "Mean value sample" out of a collection, the ring widths can be detrended
before they are added to the mean value ring width curve.
You do want detrending when you take a mean value curve from many different trees. You do not want detrending when you analyze several radii from the same tree. |
|
When possible you will probably measure several radii of a tree. When you add such ring width series to
other series based on a single radii per tree the multi-radii trees will be overrepresented in your sum.
To avoid this you can turn on the "Sum by stem" option before you click "Create Mean value sample".
CDendro assumes that sample names like NMVK04A, NMVK04B, NMVK04C come from the same tree. I.e. the radius identity is represented by a letter after a digit. Even NMVK04D1 and NMVK04D2 are considered radii of the same tree. In actual cases (related to crossdating) I have seen no significant difference between mean values from the collection as a whole or from a by-stem-calculation. What matters is correctly measured radii. |
|
When you click the button "Create Mean value sample" in a CDendro collection window, the resulting normalized curve is calculated
as mean values of all the collection members' normalized data.
During this process we can also calculate two standard deviation curves running as an
envelope on each side of the mean value normalized curve.
In CDendro we may save such a mean value normalized curve in normalized format, e.g. as a .d12 file (for the P2Yrs normalization method).
Such a file can then be used as a member of another collection consisting of e.g. reference curves.
You can find an example of a published normalized curve in Ernst Hollstein's book "Mitteleuropäische Eichenchronologie" (Middle European Oak chronology, 1980) where a long chronology is published as "Wuchswert" ("Growth value") created as log(w1/w2) where w1 and w2 are adjacent ring widths. This table of data has attracted much attention during the years from dendrochronologists who wanted access to Hollstein's tree ring oak chronology. Though as most dendrochronologists did not work with Hollstein's normalization method (Wuchswert), they had to spend time on creating an approximation for Hollstein's mean value ring width curve. Publishing tree ring data in any normalized format can really be called in question as it implies loss of ring width information and may prohibit other researchers from using the data. - Another aspect is that there is no commonly aggreed-to format for publishing such data! (Best is to publish raw measurements and leave its processing to the reader.) Note: Hollstein also published his data as carefully hand drawn mean value ring width curve diagrams. These have been digitized into Tucson .rwl files with CooRecorder and CDendro and
all that data was published on this site in August 2008, see The European oak chronology
N.B. Hollstein published mean value curves. What is missing are the raw ring width measurements from individual samples.
|